
Elastic Stack, formerly known as ELK Stack (Elasticsearch, Logstash, and Kibana), is a powerful suite of open-source tools for searching, analysing, and visualising data in real-time. This guide explain how to install and setup elastic stack on ubuntu.
For teams managing multiple servers or performing repeatable setups, CloudRay can help automate the installation of Elastic Stack using Bash scripts, without needing to SSH into each server manually.
Contents
- Install Java for Elastic Stack
- Install and Configure Elasticsearch
- Install Logstash
- Install and Configure Kibana
- Install and Configure Filebeat
- Automate the Installation of Elastic Stack with CloudRay
Install Java for Elastic Stack
Elastic stack requires Java component to run. Follow these steps to install Java.
- Update the server’s package index
sudo apt update- Install the package to access repository over HTTPS
sudo apt install apt-transport-https -y- Install OpenJDK 11 using the APT package manager
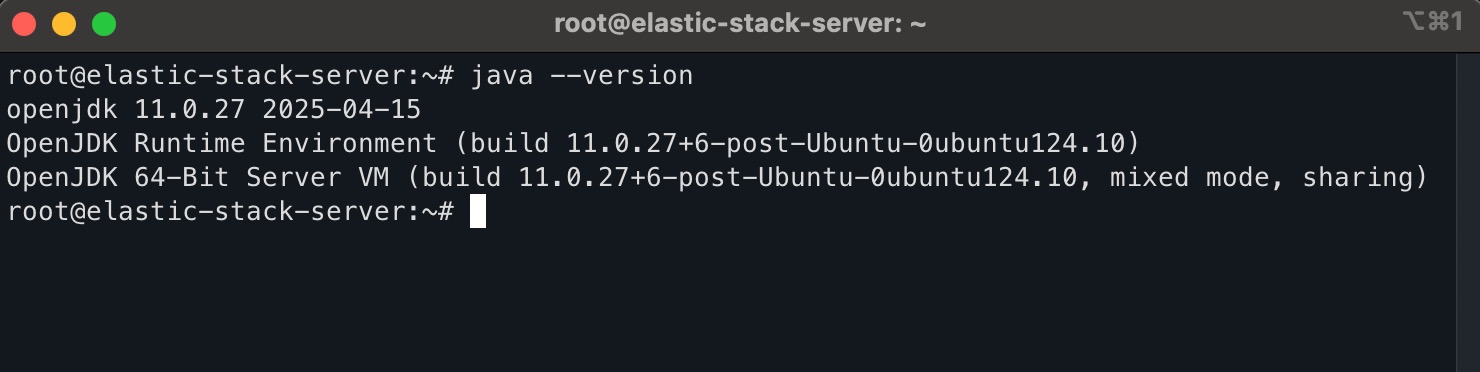
sudo apt install openjdk-11-jdk -y- Verify the Java installation
java --versionYour output should be like
- Set the
JAVA_HOMEenvironment variable
sudo nano /etc/environmentAdd the following line at the end of the file:
JAVA_HOME="/usr/lib/jvm/java-11-openjdk-amd64"Save the file.
- Reload the new environment variable
source /etc/environment
echo $JAVA_HOME
Install and Configure Elasticsearch
Elasticsearch is the core engine of the Elastic Stack. It provides distributed search and analytics capabilities across all types of data. Follow the steps below to install and configure Elasticsearch on your Ubuntu server.
- Import the Elasticsearch GPG key
wget -qO - https://artifacts.elastic.co/GPG-KEY-elasticsearch | sudo gpg --dearmor -o /usr/share/keyrings/elasticsearch-keyring.gpg- Add the Elasticsearch APT repository
echo "deb [signed-by=/usr/share/keyrings/elasticsearch-keyring.gpg] https://artifacts.elastic.co/packages/8.x/apt stable main" | sudo tee /etc/apt/sources.list.d/elastic-8.x.list- Update the APT package index
sudo apt update- Install Elasticsearch
sudo apt install elasticsearch -y- Start and enable the Elasticsearch service
sudo systemctl start elasticsearch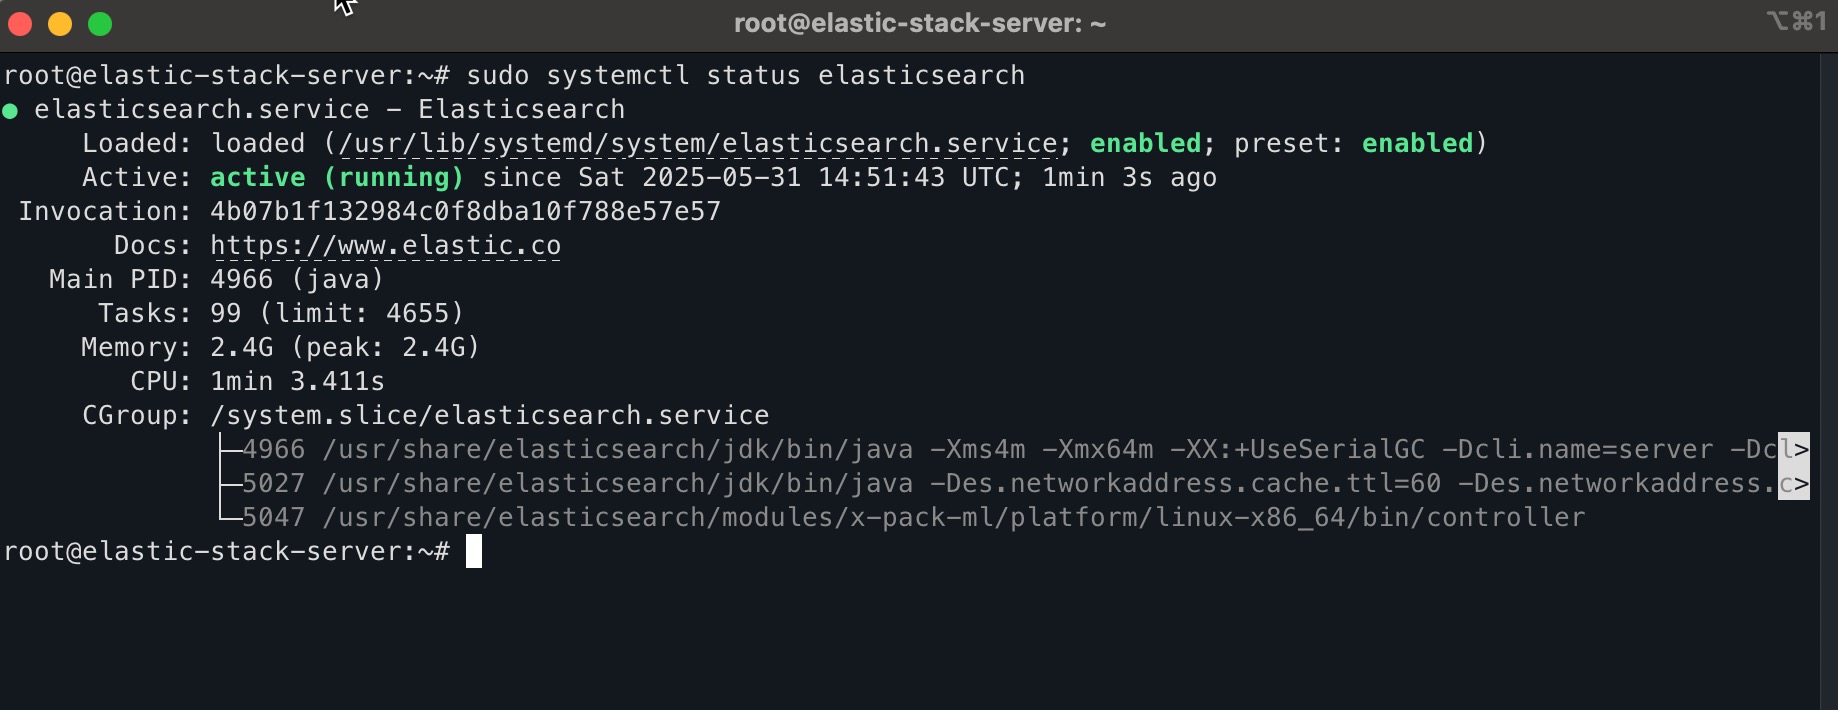
sudo systemctl enable elasticsearch- Verify that Elasticsearch is running
sudo systemctl status elasticsearchYou should see output indicating that the service is active and running.
- Configure Elasticsearch
sudo nano /etc/elasticsearch/elasticsearch.ymlInside the file, locate the network and discovery sections, then make the following changes:
- Set Elasticsearch to listen on all network interfaces
network.host: 0.0.0.0- Set the discovery seed hosts to an empty array (for single-node setups)
discovery.seed_hosts: []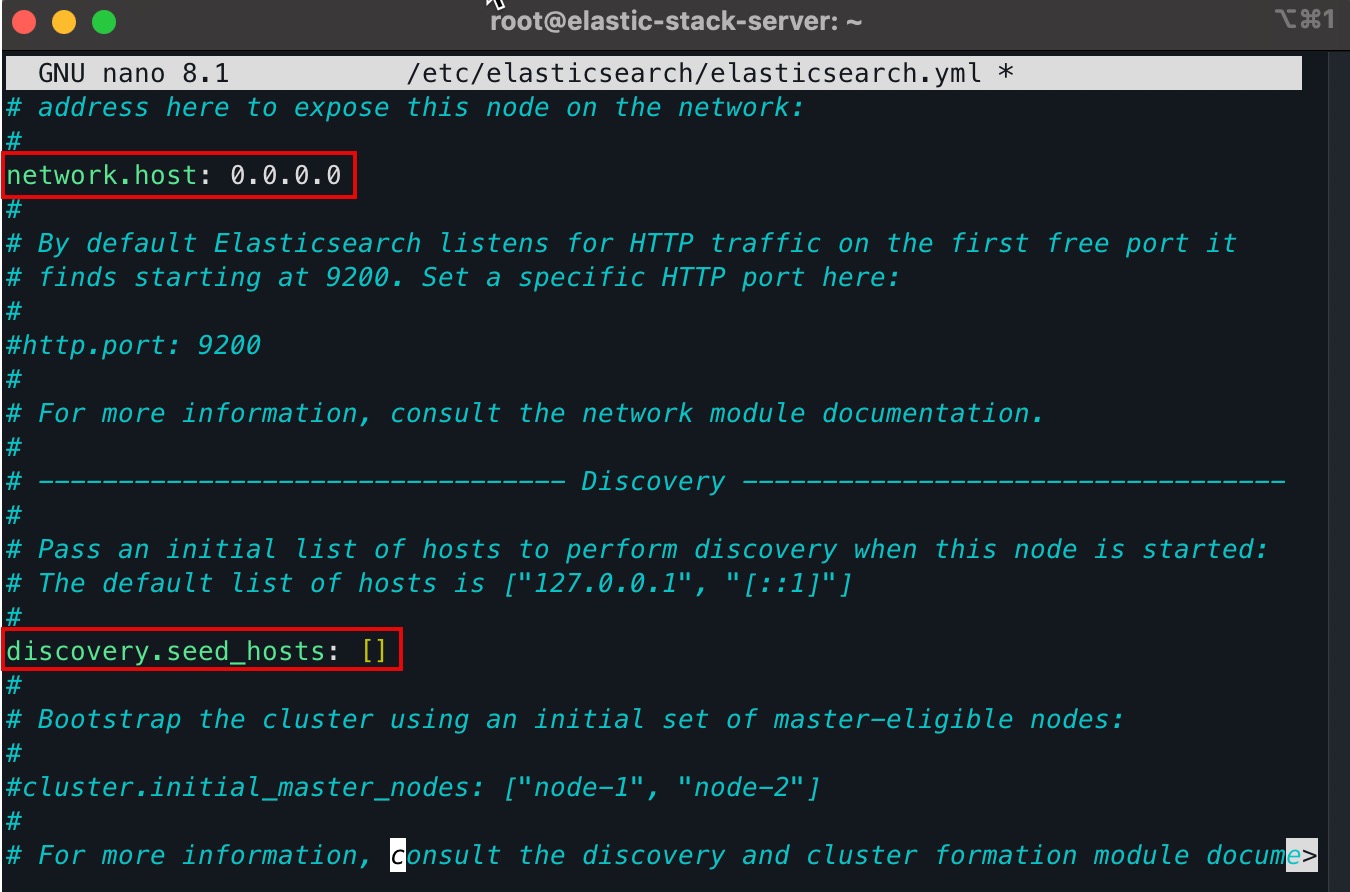
- For basic development environments, you can disable the security layer
xpack.security.enabled: falseThis is not recommended for production use.
- Restart the Elasticsearch service to apply changes
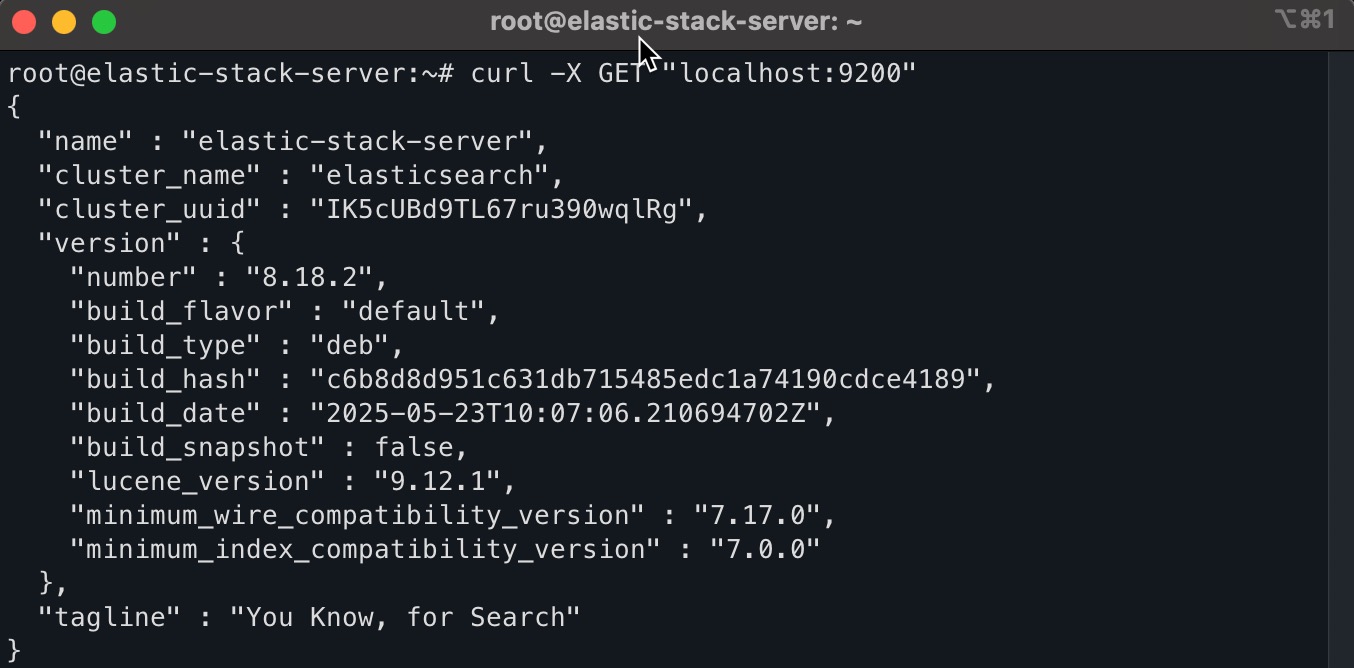
sudo systemctl restart elasticsearch- Run the following command to check if the Elasticsearch instance is reachable
curl -X GET "localhost:9200"You should receive a JSON response showing Elasticsearch version details and cluster status.
Install Logstash
Logstash is a powerful data processing pipeline that ingests, transforms, and sends data to your desired destination, typically Elasticsearch. It allows you to parse logs or structured data and filter them before storage or visualisation. Follow these steps to install and start Logstash on your Ubuntu server.
- Install Logstash
sudo apt install logstash -y- Start and enable the Logstash service
sudo systemctl start logstash
sudo systemctl enable logstash- Check the Logstash service status
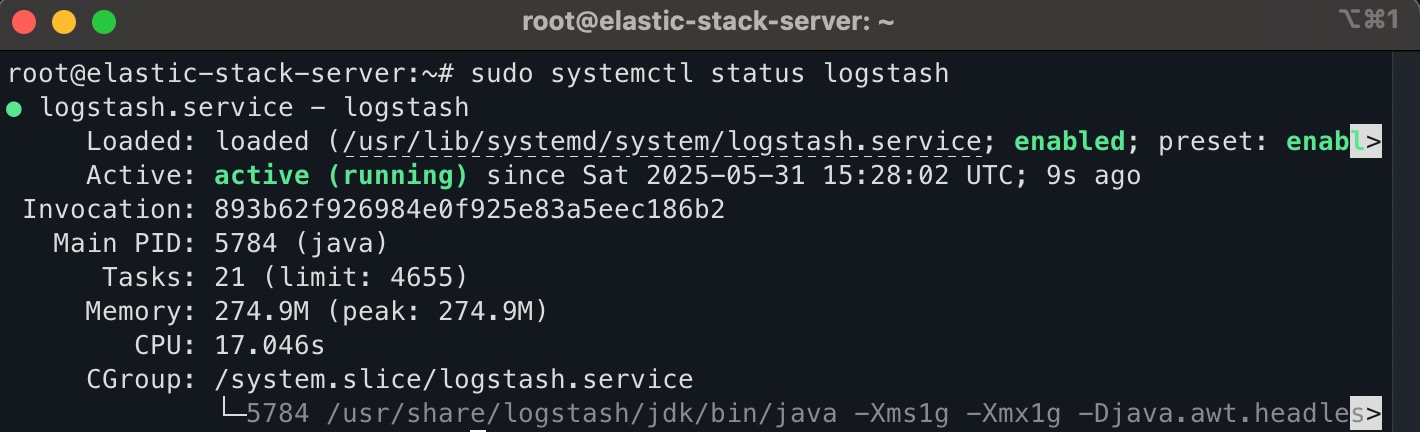
sudo systemctl status logstashYou should see that the Logstash service is active (running).
Install and Configure Kibana
Kibana is the visualisation layer of the Elastic Stack. It provides a web-based interface for exploring and visualising data stored in Elasticsearch. After installing Kibana, you can access dashboards, perform searches, and monitor your logs in real time. Follow the steps below to install and configure Kibana on your Ubuntu server.
- Install Kibana
sudo apt install kibana -y- Start and enable the Kibana service
sudo systemctl start kibana
sudo systemctl enable kibana- Check the Kibana service status
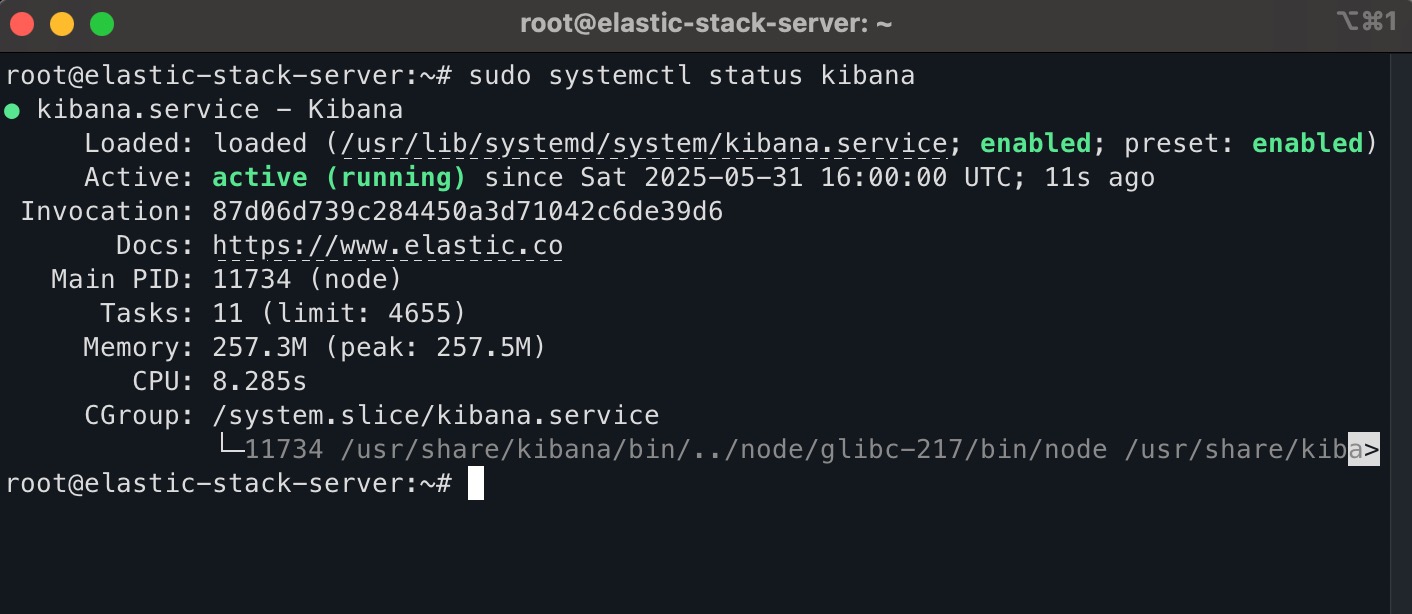
sudo systemctl status kibanaYou should see an active (running) status if the service started successfully.
- Configure Kibana by opening the Kibana configuration file
sudo nano /etc/kibana/kibana.ymlUncomment and modify the following lines to allow Kibana to bind to any interface and connect to your local Elasticsearch instance:
server.port: 5601
server.host: "0.0.0.0"
elasticsearch.hosts: ["http://localhost:9200"]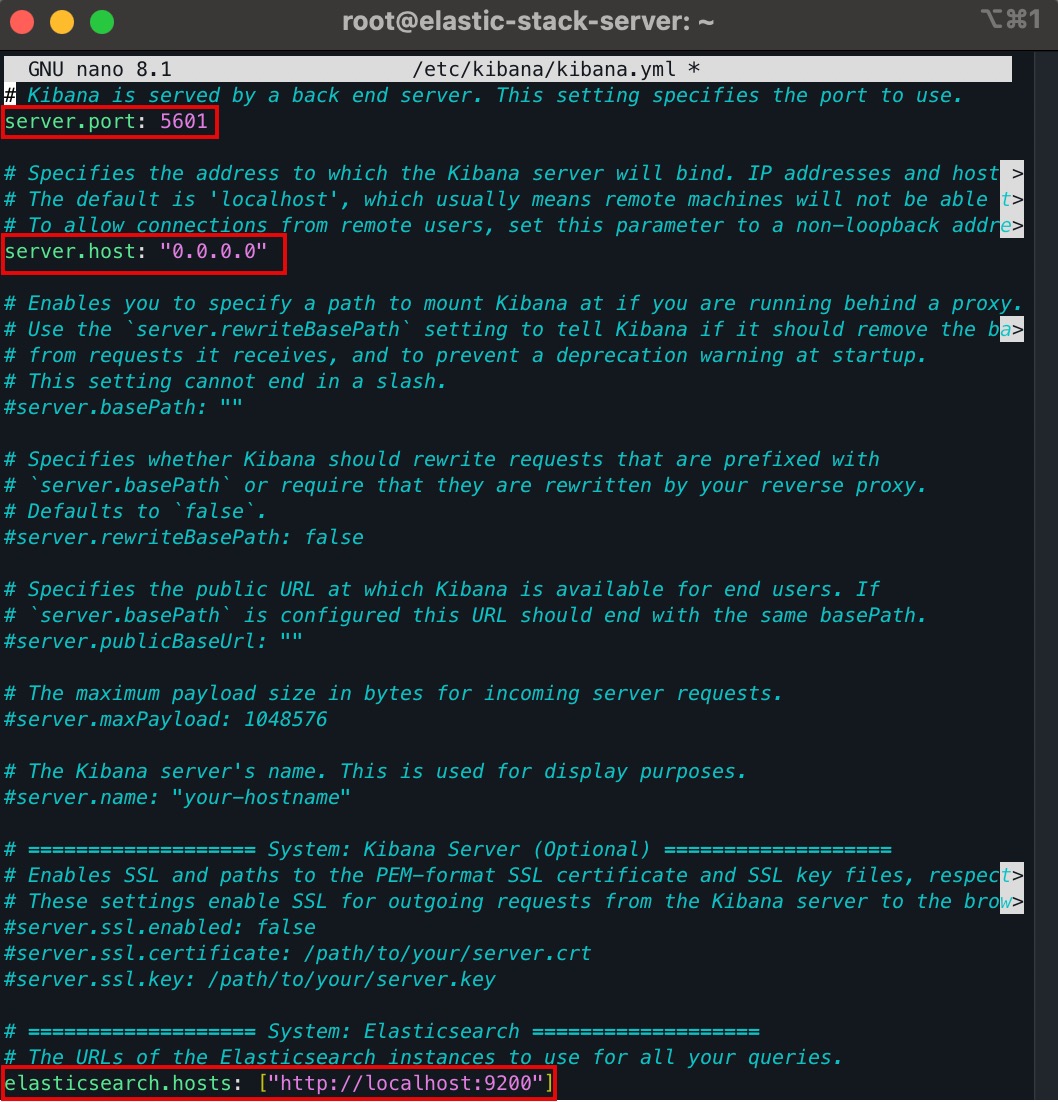
Save and close the file
- Restart Kibana to apply the changes
sudo systemctl restart kibana- Adjust the firewall to open port 5601:
sudo ufw allow 5601/tcp- Once restarted, Kibana will be accessible via your server’s IP address on port
5601
http://your_server_ip:5601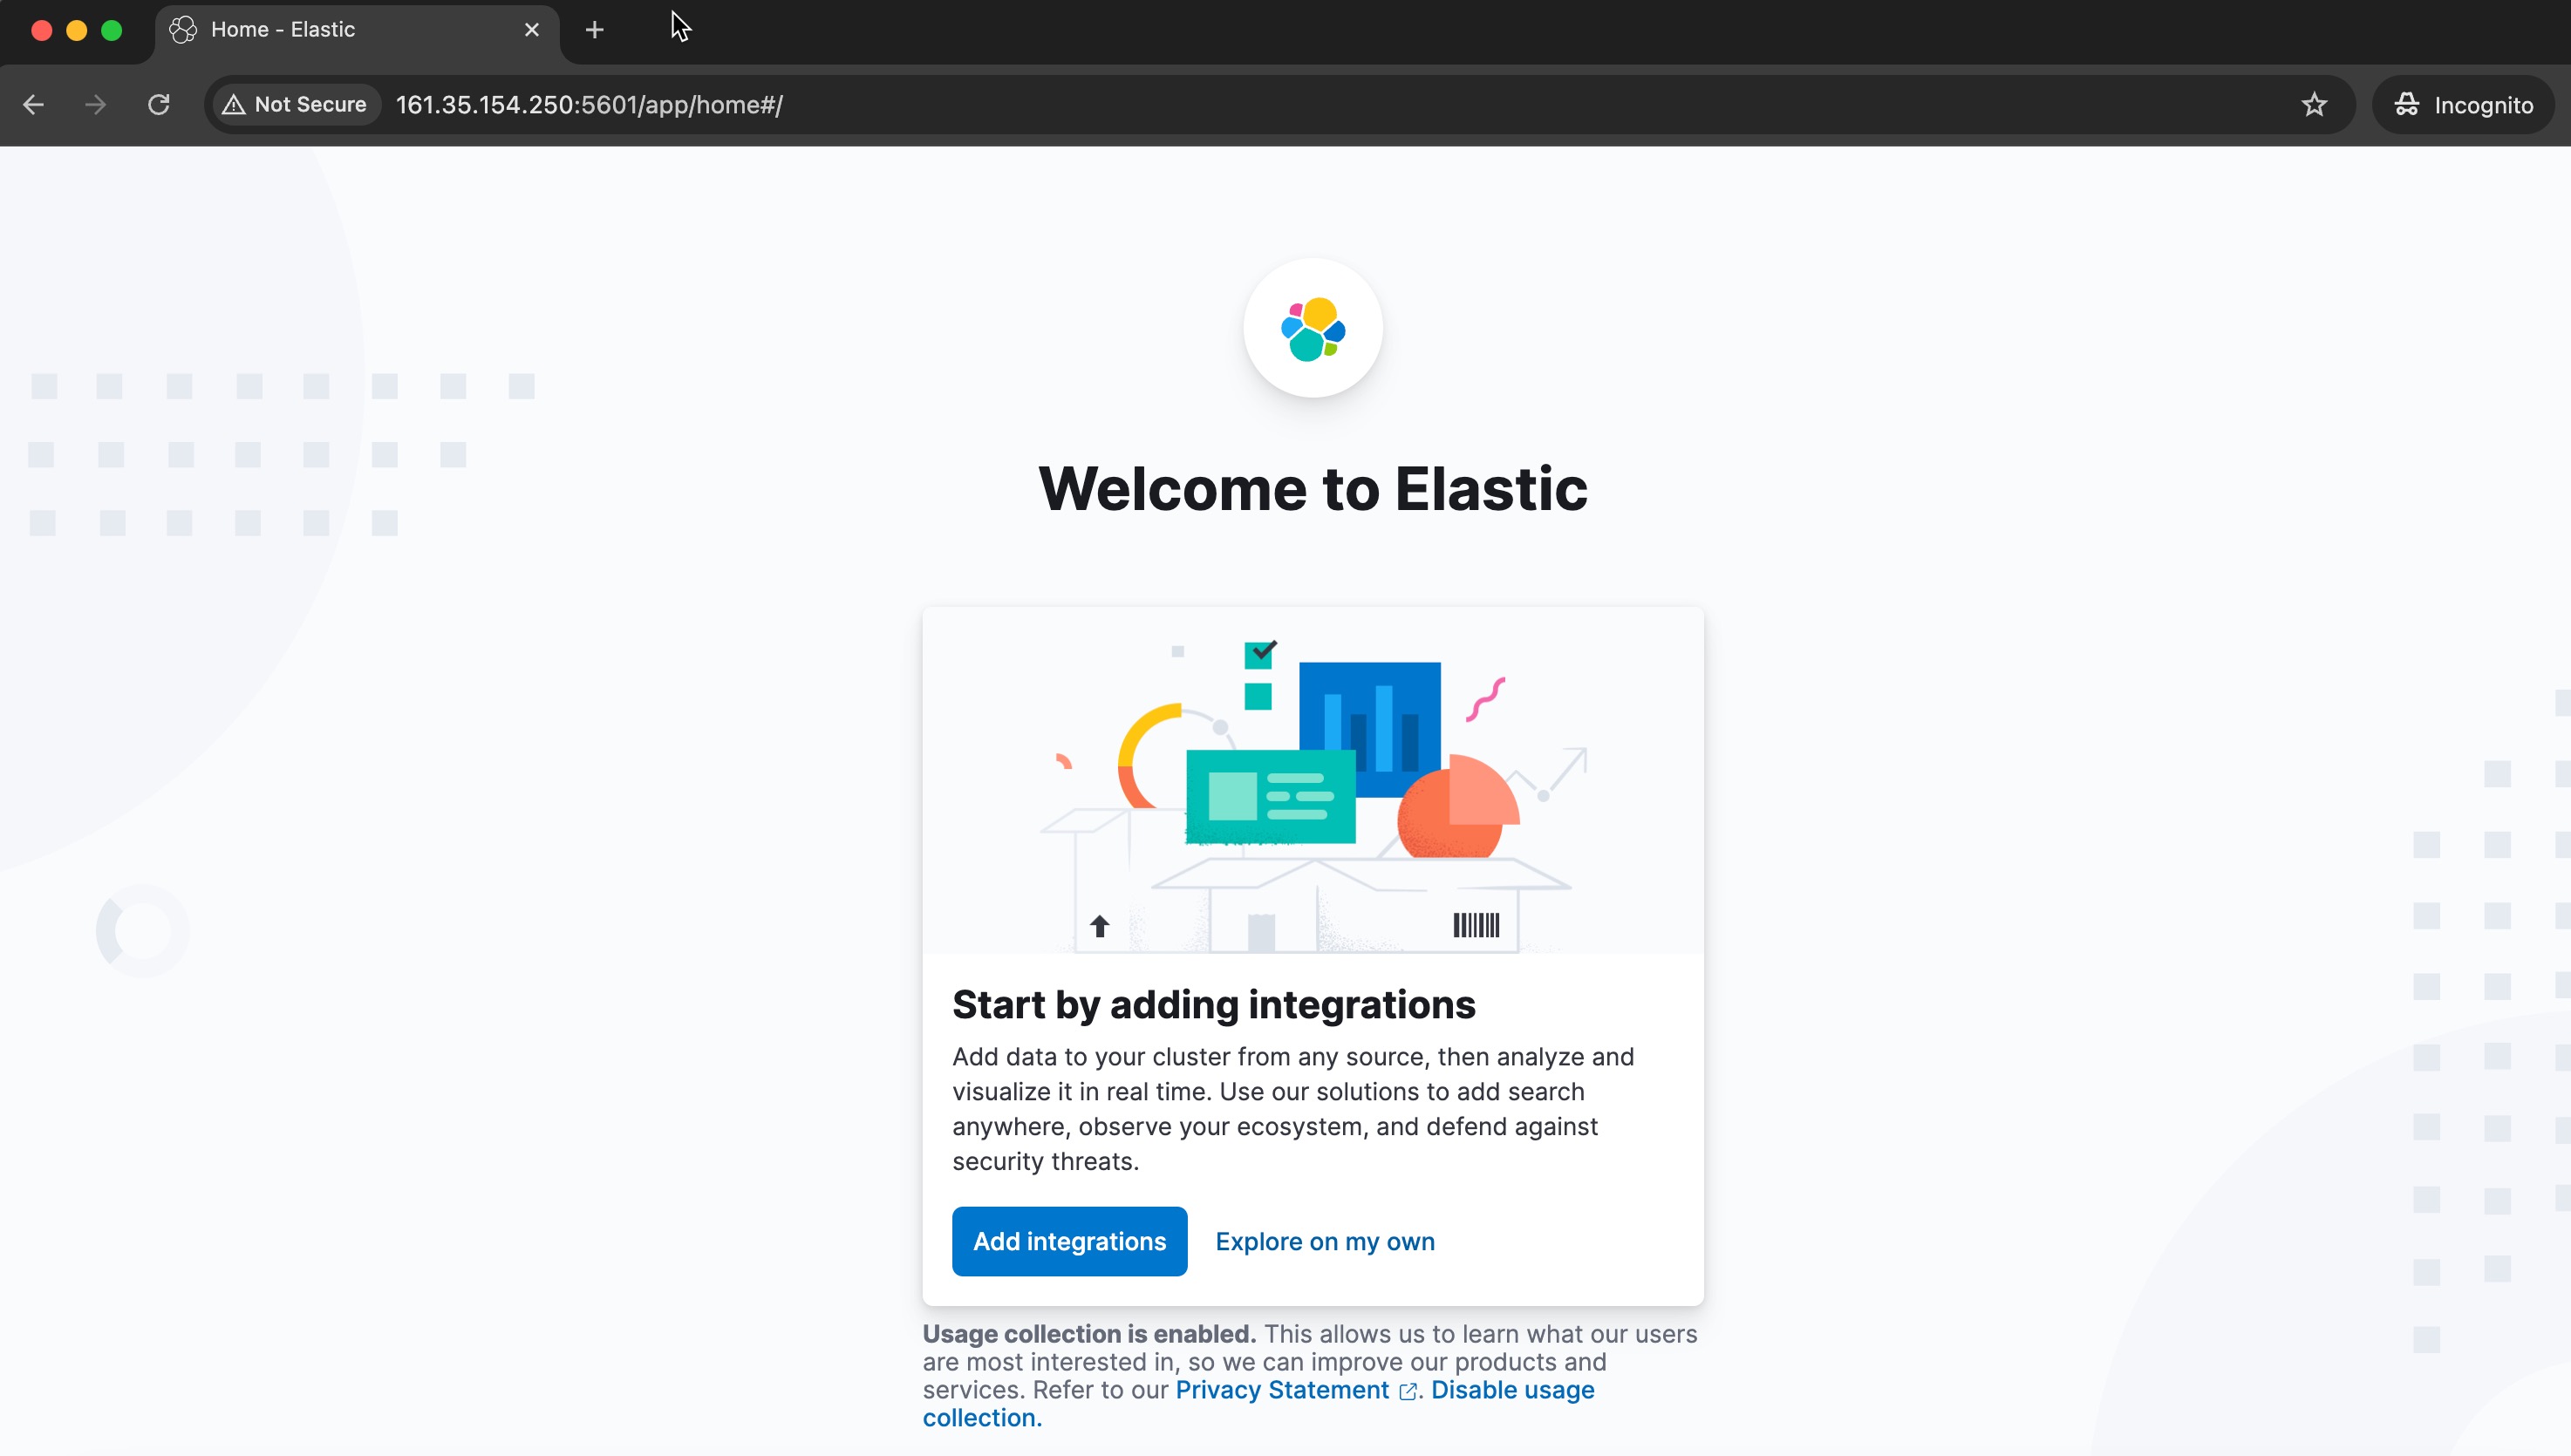
Install and Configure Filebeat
Filebeat is a lightweight log shipper that forwards and centralises log data. It collects logs and forwards them to Logstash for processing or directly to Elasticsearch for indexing and visualisation in Kibana. Follow these steps to install and configure Filebeat on your Ubuntu server.
- Install Filebeat from the Elastic repository:
sudo apt install filebeat -y- Configure Filebeat by editing the configuration file:
sudo nano /etc/filebeat/filebeat.yml- Comment out the Elasticsearch output section to disable direct shipping to Elasticsearch
#output.elasticsearch:
# hosts: ["localhost:9200"]- Uncomment the Logstash output section and set it to point to your local Logstash instance
output.logstash:
  hosts: ["localhost:5044"]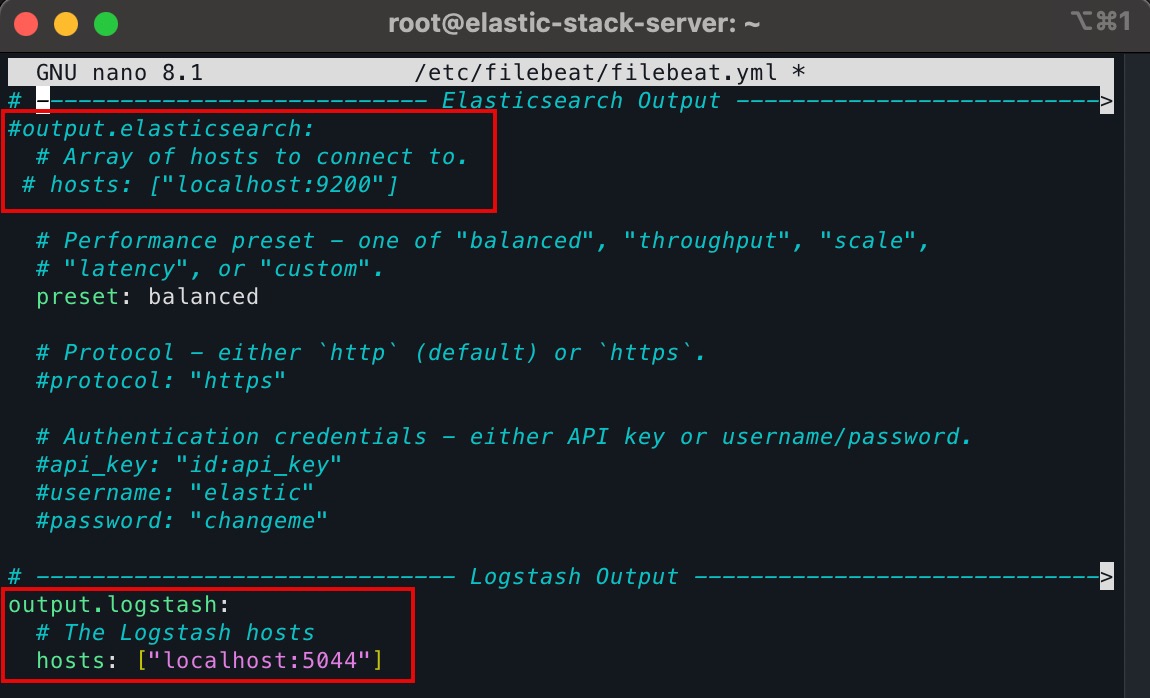
- Enable the system module to collect logs from the system itself
sudo filebeat modules enable system- Restart the Elasticsearch service to apply changes
sudo systemctl restart elasticsearch- initialise index management (this will temporarily enable Elasticsearch output just for the setup)
sudo filebeat setup --index-management -E output.logstash.enabled=false -E 'output.elasticsearch.hosts=["0.0.0.0:9200"]'- start and enable Filebeat to run on system boot:
sudo systemctl start filebeat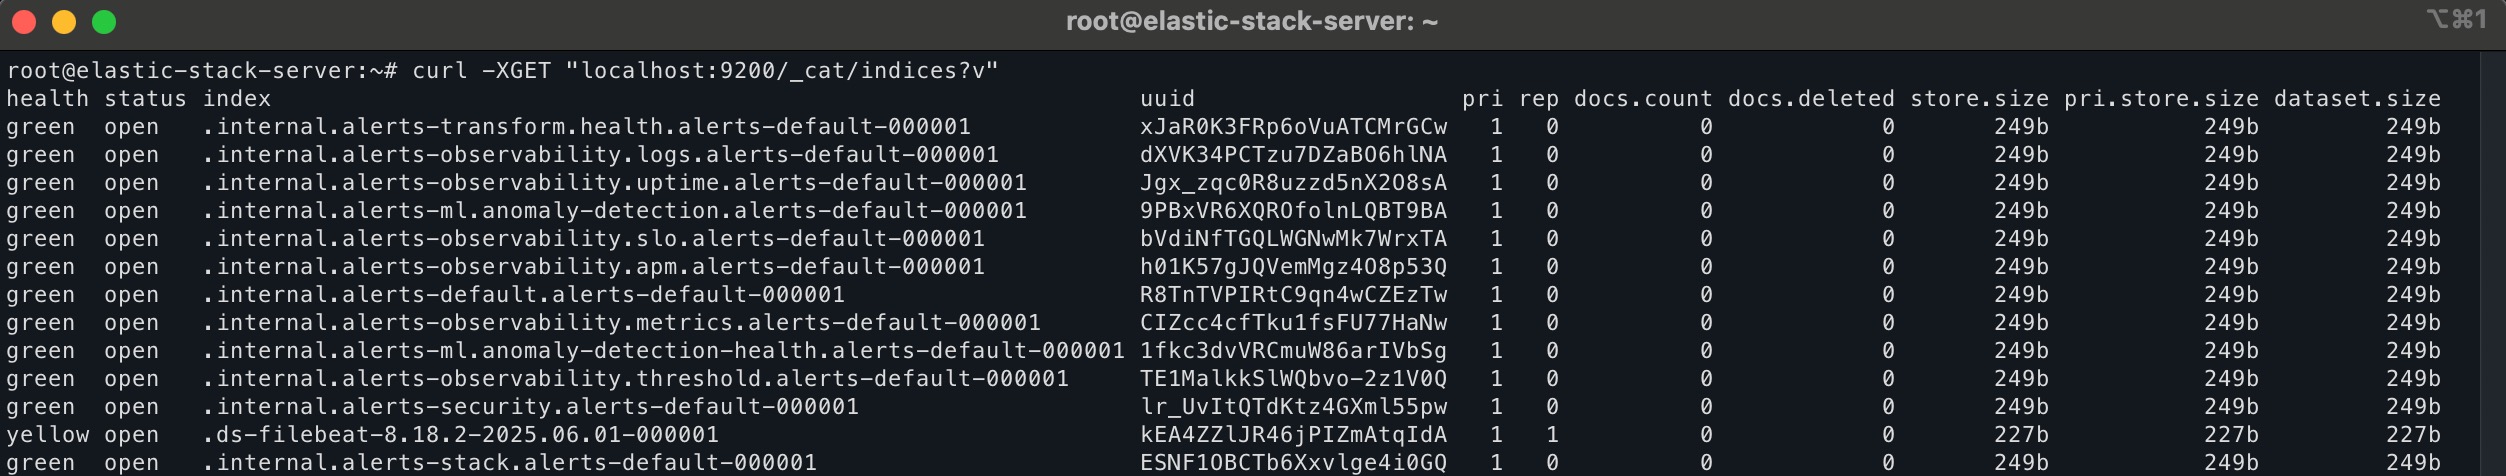
sudo systemctl enable filebeat- You can confirm that Filebeat is successfully shipping logs by checking indices in Elasticsearch
curl -XGET "localhost:9200/_cat/indices?v"You should see indices prefixed with filebeat- in the output.
Automate the Installation of Elastic Stack with CloudRay
Manually setting up the Elastic Stack across multiple servers can be time-consuming, especially when repeating the same steps on each server. CloudRay simplifies this process by allowing you to create reusable Bash scripts that can be executed remotely across your infrastructure.
With CloudRay, you can automate the entire Elastic Stack setup — from installing Java, Elasticsearch, Logstash, Kibana, and Filebeat without logging into each server individually.
Before you automate the installation process, connect your server to CloudRay using the CloudRay agent. This allows you to run bash scripts directly from the dashboard without SSH access.

Olusegun Durojaye
CloudRay Engineering Team