
This guide demonstrates how to automate Grafana deployments using CloudRay’s script automation. The deployment addresses these core requirements:
- Secure default configuration with disabled anonymous access
- Nginx reverse proxy configuration
- Service isolation with proper systemd management
The approach prevents common security issues by disabling anonymous access by default, using reverse proxy for additional security layer, and implementing proper service management.
Contents
- Adding Servers to CloudRay
- Create the Automation Script
- Running the Scripts to Install Grafana with CloudRay
Adding Servers to CloudRay
Before starting automation, ensure your target servers are connected to CloudRay. If you haven’t done this yet, follow our servers docs to add and manage your server
NOTE
This guide uses Bash scripts, providing a high degree of customisation. You can adapt the scripts to fit your specific Installations needs and environment. Additionally, if you’re using a different version or a different distribution, adjust the commands accordingly
Create the Automation Script
Two Bash scripts are required for deployment:
- Install Grafana and Nginx: This script handles package installation and base configuration
- Configure Grafana: This script applies security settings and service configuration
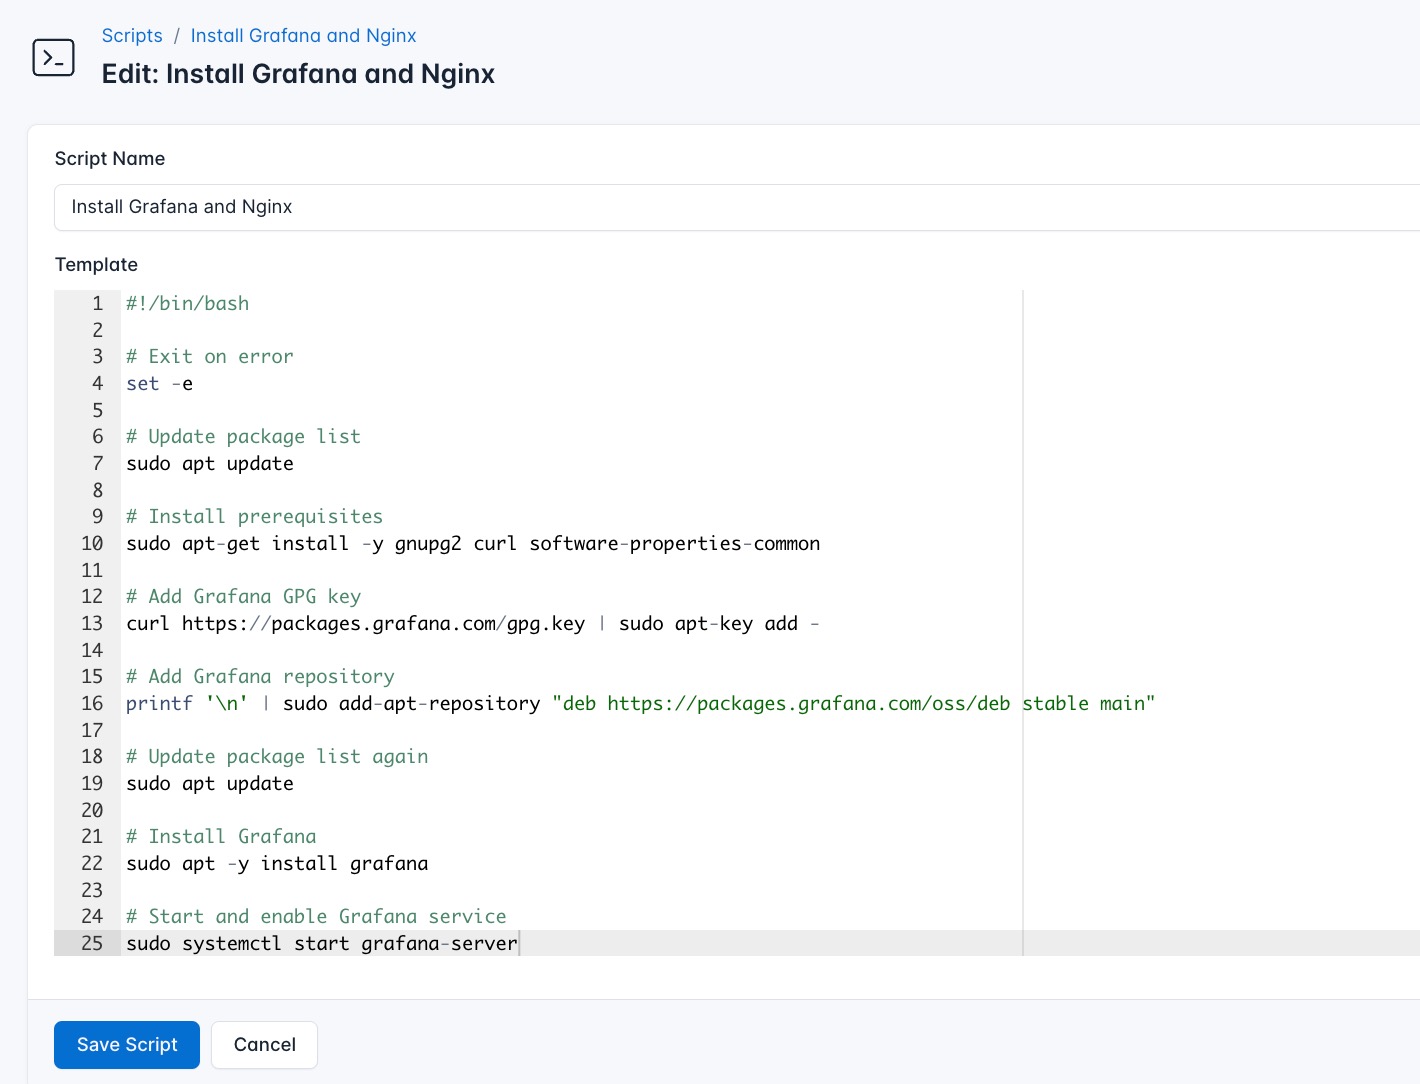
Install Grafana and Nginx
This script performs the initial server setup including package installation and reverse proxy configuration.
- Go to Scripts in your CloudRay project
- Click New Script
- Name:
Install Grafana and Nginx - Copy this code:
#!/bin/bash

# Exit immediately if a command exits with a non-zero status
set -e

# Update package list
sudo apt update

# Install required dependencies
sudo apt-get install -y gnupg2 curl software-properties-common

# Add Grafana GPG key
curl https://packages.grafana.com/gpg.key | sudo apt-key add -

# Add Grafana repository
printf '\n' | sudo add-apt-repository "deb https://packages.grafana.com/oss/deb stable main"

# Update package list again
sudo apt update

# Install Grafana
sudo apt -y install grafana

# Start and enable Grafana service
sudo systemctl start grafana-server
sudo systemctl enable grafana-server
sudo systemctl status grafana-server --no-pager

# Install Nginx
sudo apt install -y nginx

# Start and enable Nginx service
sudo systemctl start nginx
sudo systemctl enable nginx
sudo systemctl status nginx --no-pager

# Remove default Nginx site
sudo unlink /etc/nginx/sites-enabled/default

# Create Grafana Nginx config
sudo bash -c "cat > /etc/nginx/sites-available/grafana.conf" <<EOL
server {
    listen 80;
    location / {
        proxy_pass http://localhost:3000;
    }
}
EOL

# Enable the Grafana Nginx site
sudo ln -s /etc/nginx/sites-available/grafana.conf /etc/nginx/sites-enabled/grafana.conf

# Test Nginx configuration
sudo service nginx configtest

# Restart Nginx
sudo systemctl restart nginx

echo "✅ Grafana and Nginx installation completed."
Here is a breakdown of what each command in the Install Grafana and Nginx script does:
- Updates all installed packages to the latest version
- Adds official Grafana repository
- Installs Grafana and Nginx
- Configures Nginx as reverse proxy on port 80
- Validates Nginx configuration before restarting
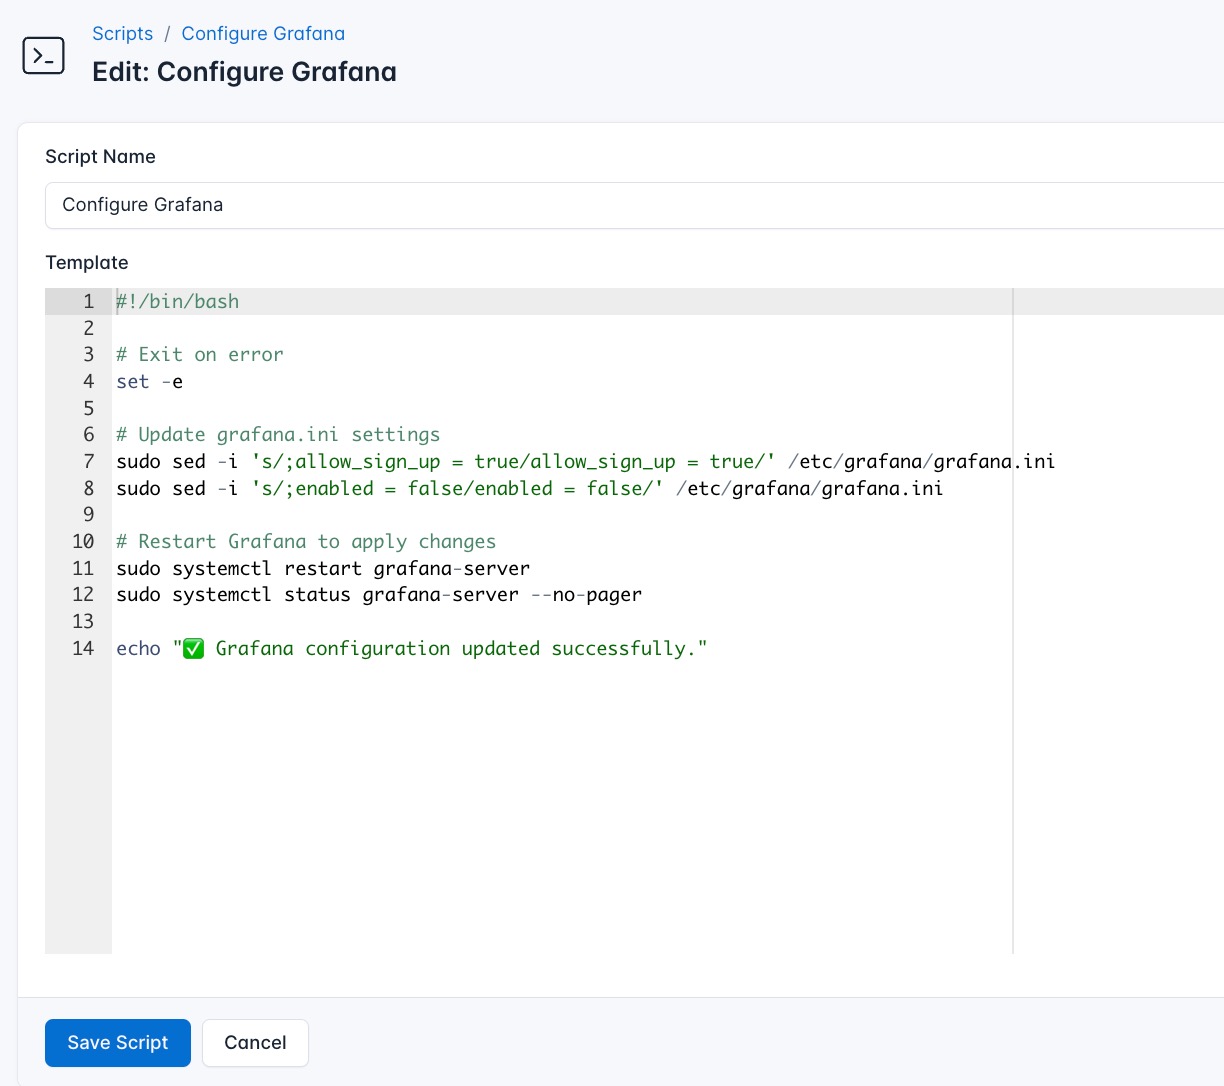
Configure Grafana
This script applies security-focused configuration to the Grafana installation.
- Go to Scripts > New Script
- Name:
Configure Grafana - Add code:
#!/bin/bash

# Exit immediately if a command exits with a non-zero status
set -e

# Update grafana.ini settings
sudo sed -i 's/;allow_sign_up = true/allow_sign_up = true/' /etc/grafana/grafana.ini
sudo sed -i 's/;enabled = false/enabled = false/' /etc/grafana/grafana.ini

# Restart Grafana to apply changes
sudo systemctl restart grafana-server
sudo systemctl status grafana-server --no-pager

echo "✅ Grafana configuration updated successfully."
This is what the Configure Grafana does:
- Disables anonymous access by default
- Restricts sign-ups (to be enabled per requirement)
- Ensures changes are applied with service restart
Running the Scripts to Install Grafana with CloudRay
Now that everything is setup, you can use CloudRay to automate the installation of Grafana.
You can choose to run the scripts individually or execute them all at once using CloudRay’s Script Playlists. Since there are multiple scripts, using CloudRay playlists will help automate the execution sequence and save time.
Here are the steps to follow:
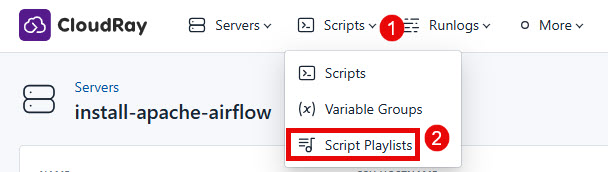
- Navigate to “Script Playlists”: Click on the Scripts tab in the CloudRay interface
- Click “Add Script Playlist”: This initiates the creation of a new playlist
- Provide a Name: Give your playlist a unique name (For example “Automate Grafana Installation”)
- Add Scripts in Order: Select and add the scripts sequentially
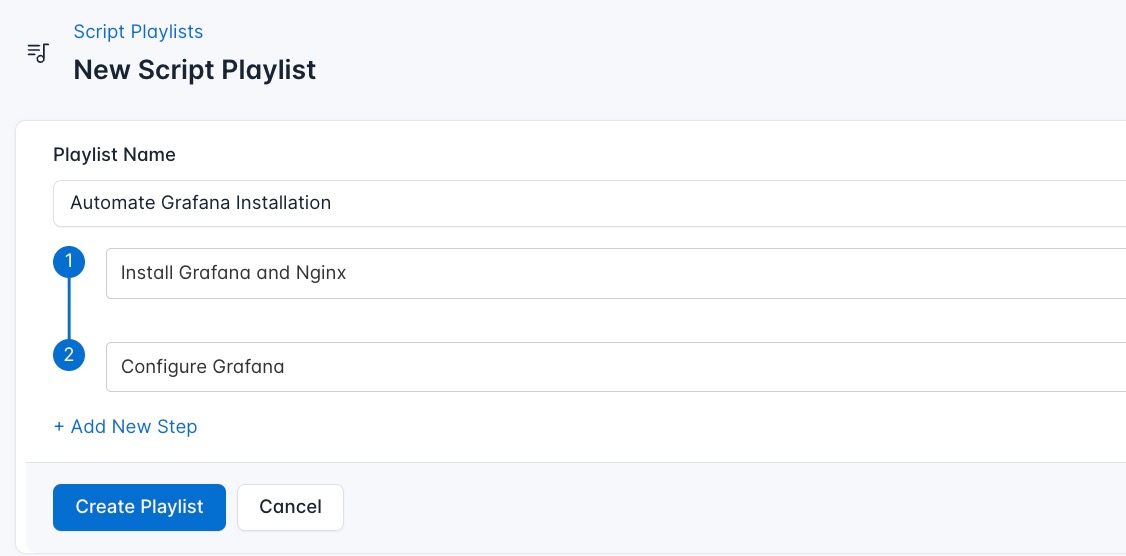
- Save the Playlist: Click “create playlist” to store your new playlist.
Once your script playlist is created, proceed with execution:
- Navigate to Runlogs: In your CloudRay project, go to the Runlogs section in the top menu.
- Create a New Runlog: Click on New Runlog.
- Configure the Runlog: Provide the necessary details:
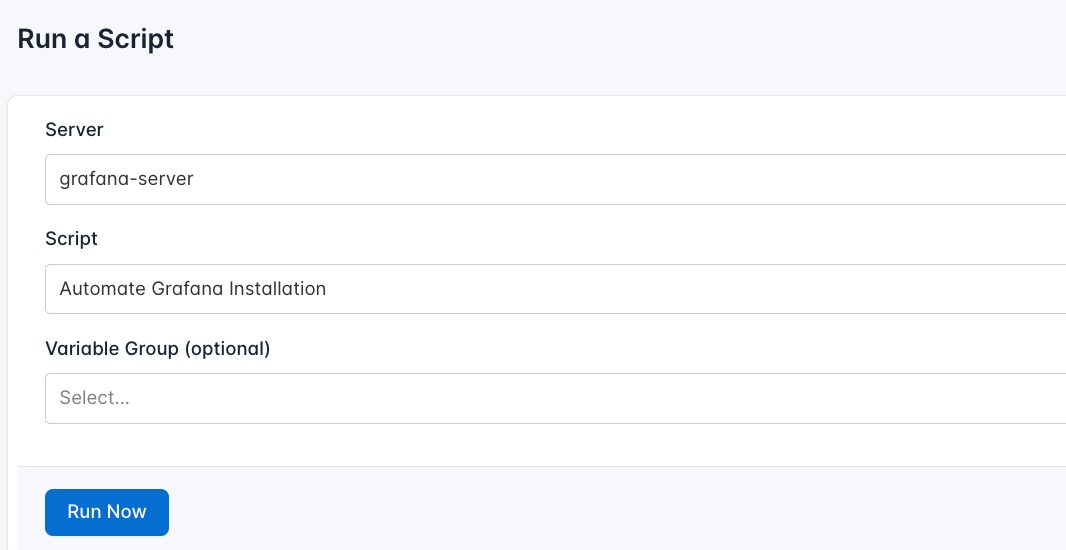
- Server: Select the server where Grafana will be installed
- Script Playlist: Choose the playlist you created (For example “Automate Grafana Installation”)
- Variable Group: Select the variable group you set up earlier
- Execute the Script: Click on Run Now to start the execution
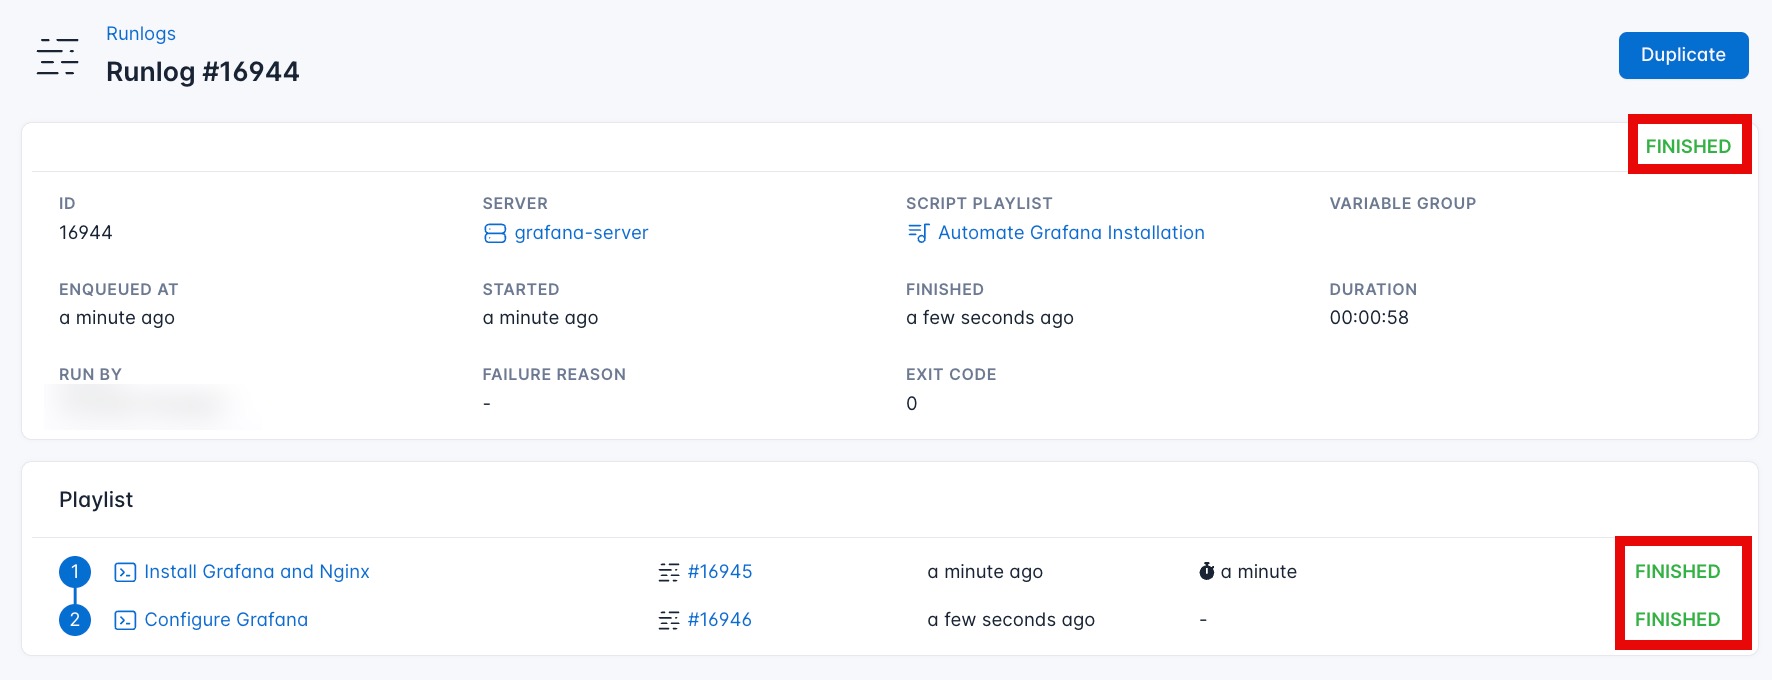
Once the script runs successfully, your Grafana will be fully deployed. You can now visit your Grafana using your domain on port 3000 (http://SERVER_IP:3000).
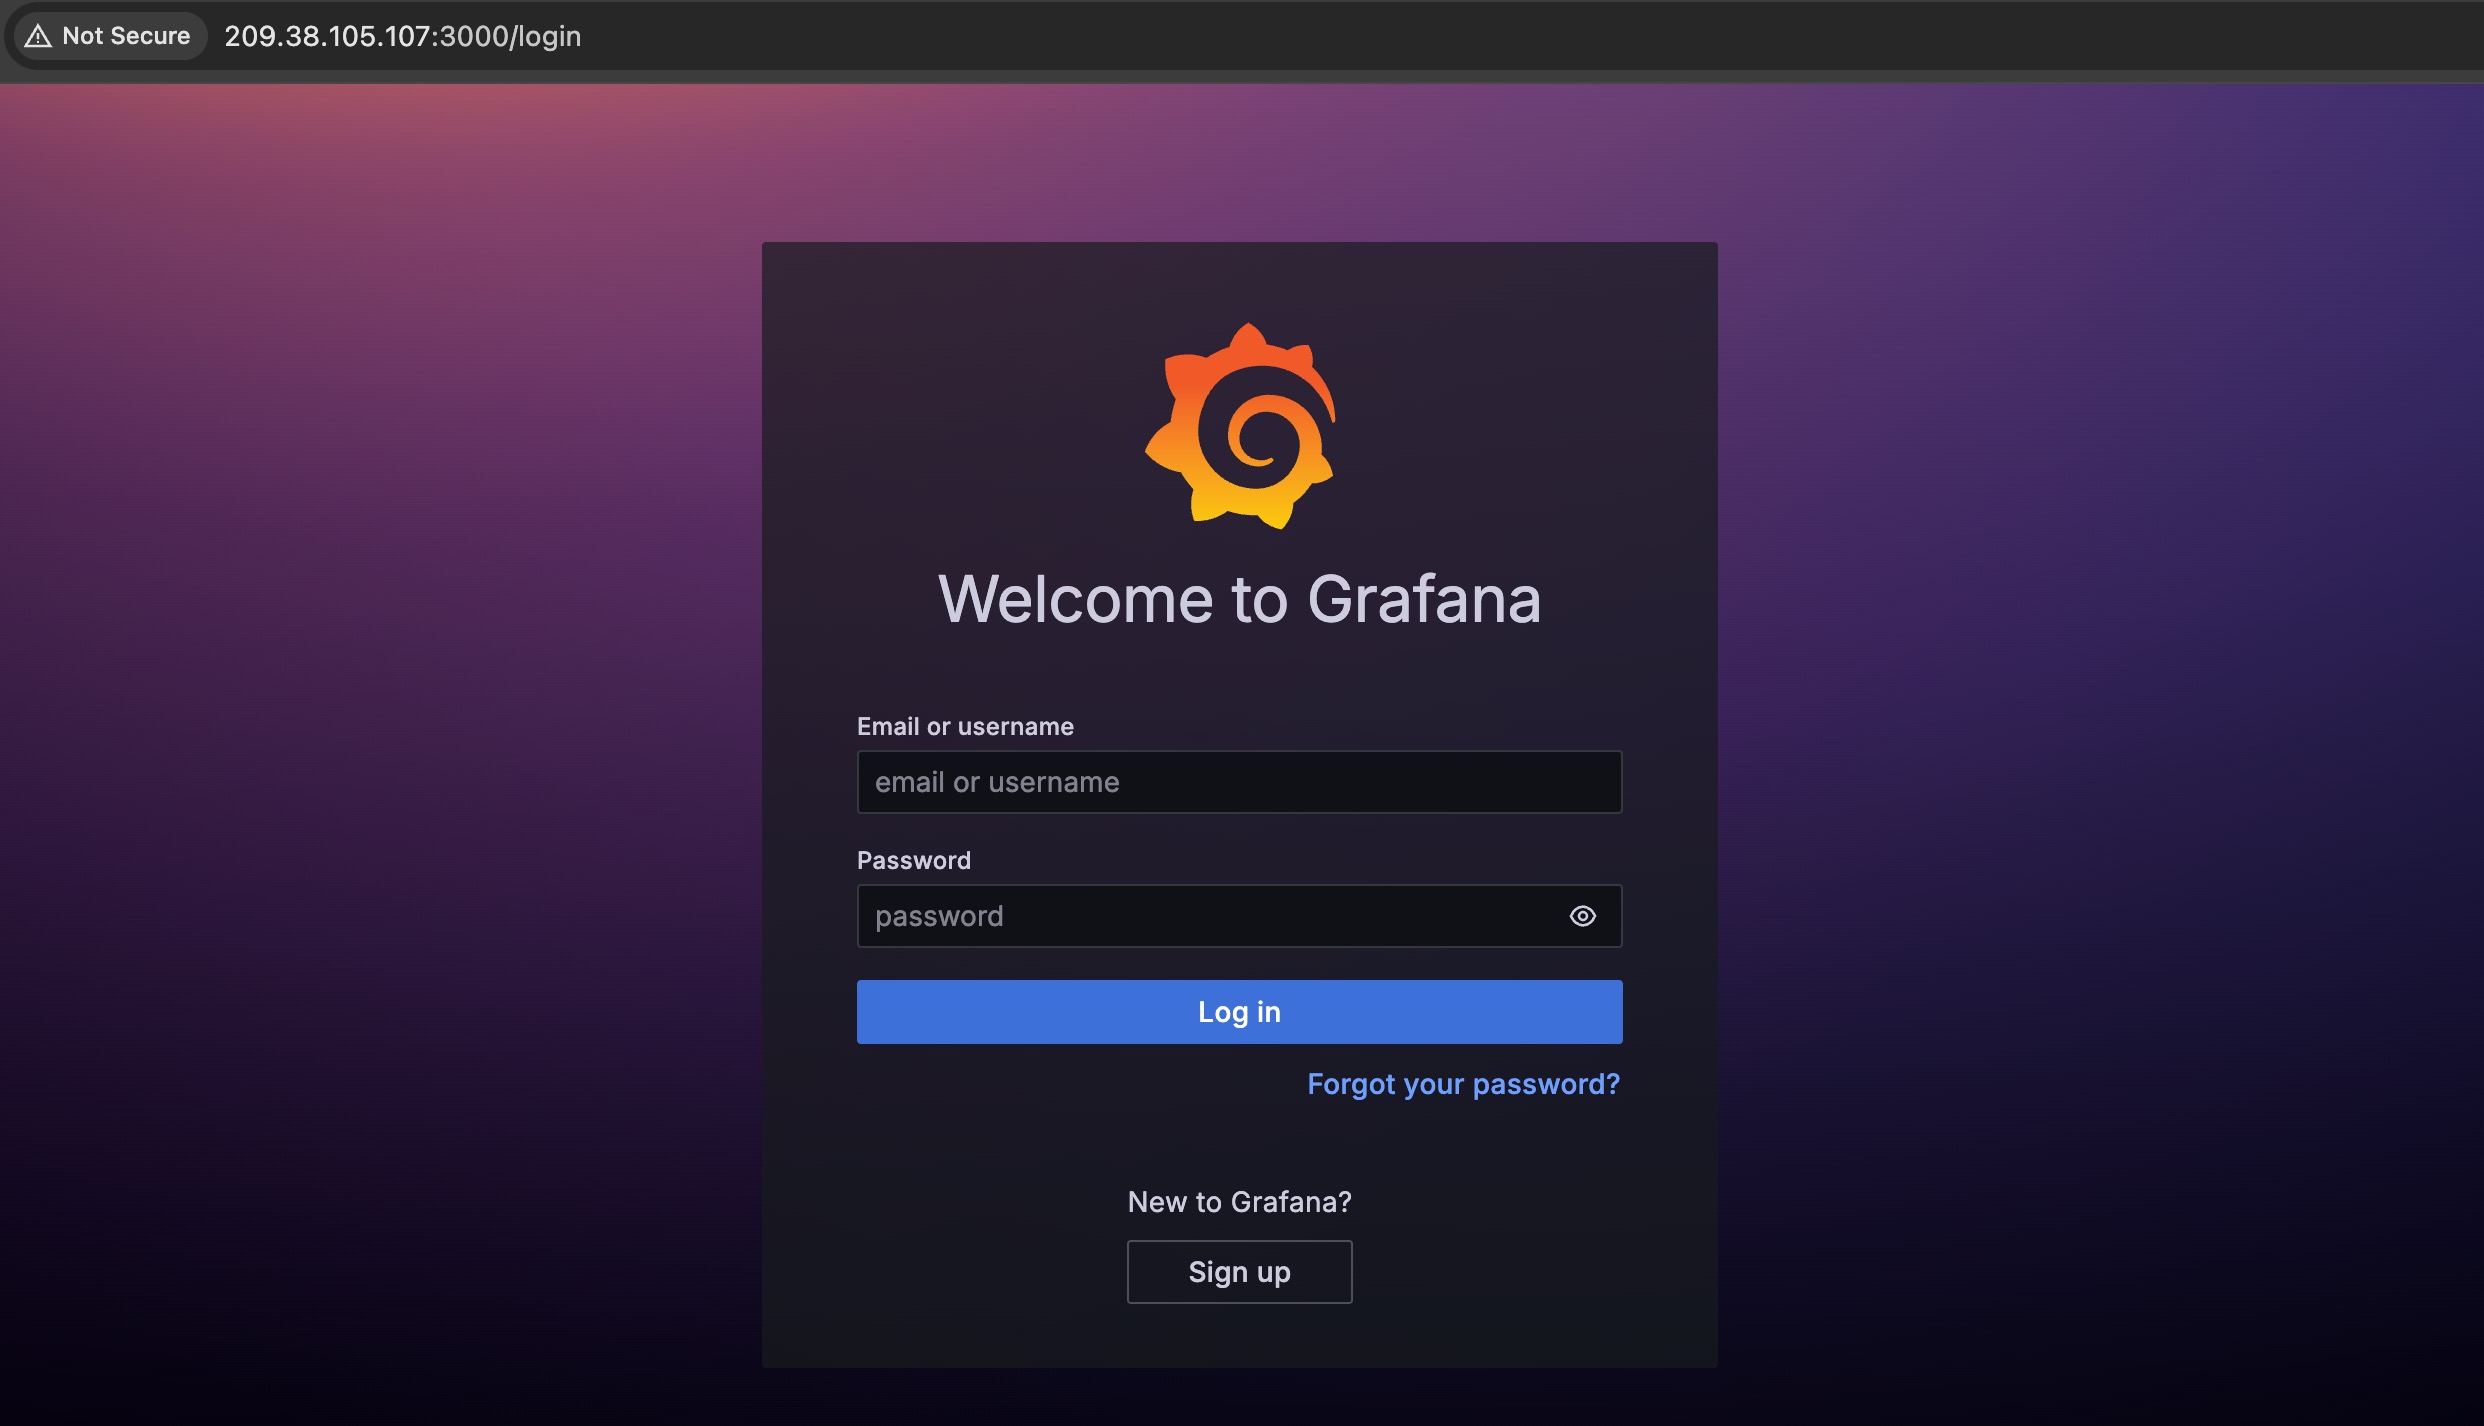
Your Grafana is now deployed and managed with CloudRay. You use the username admin and password admin to access your dashboard. It’s best practice to reconfigure the default credentials (username and password).

Olusegun Durojaye
CloudRay Engineering Team